PQ Interval Data
Power quality data for utility customers and stakeholders.

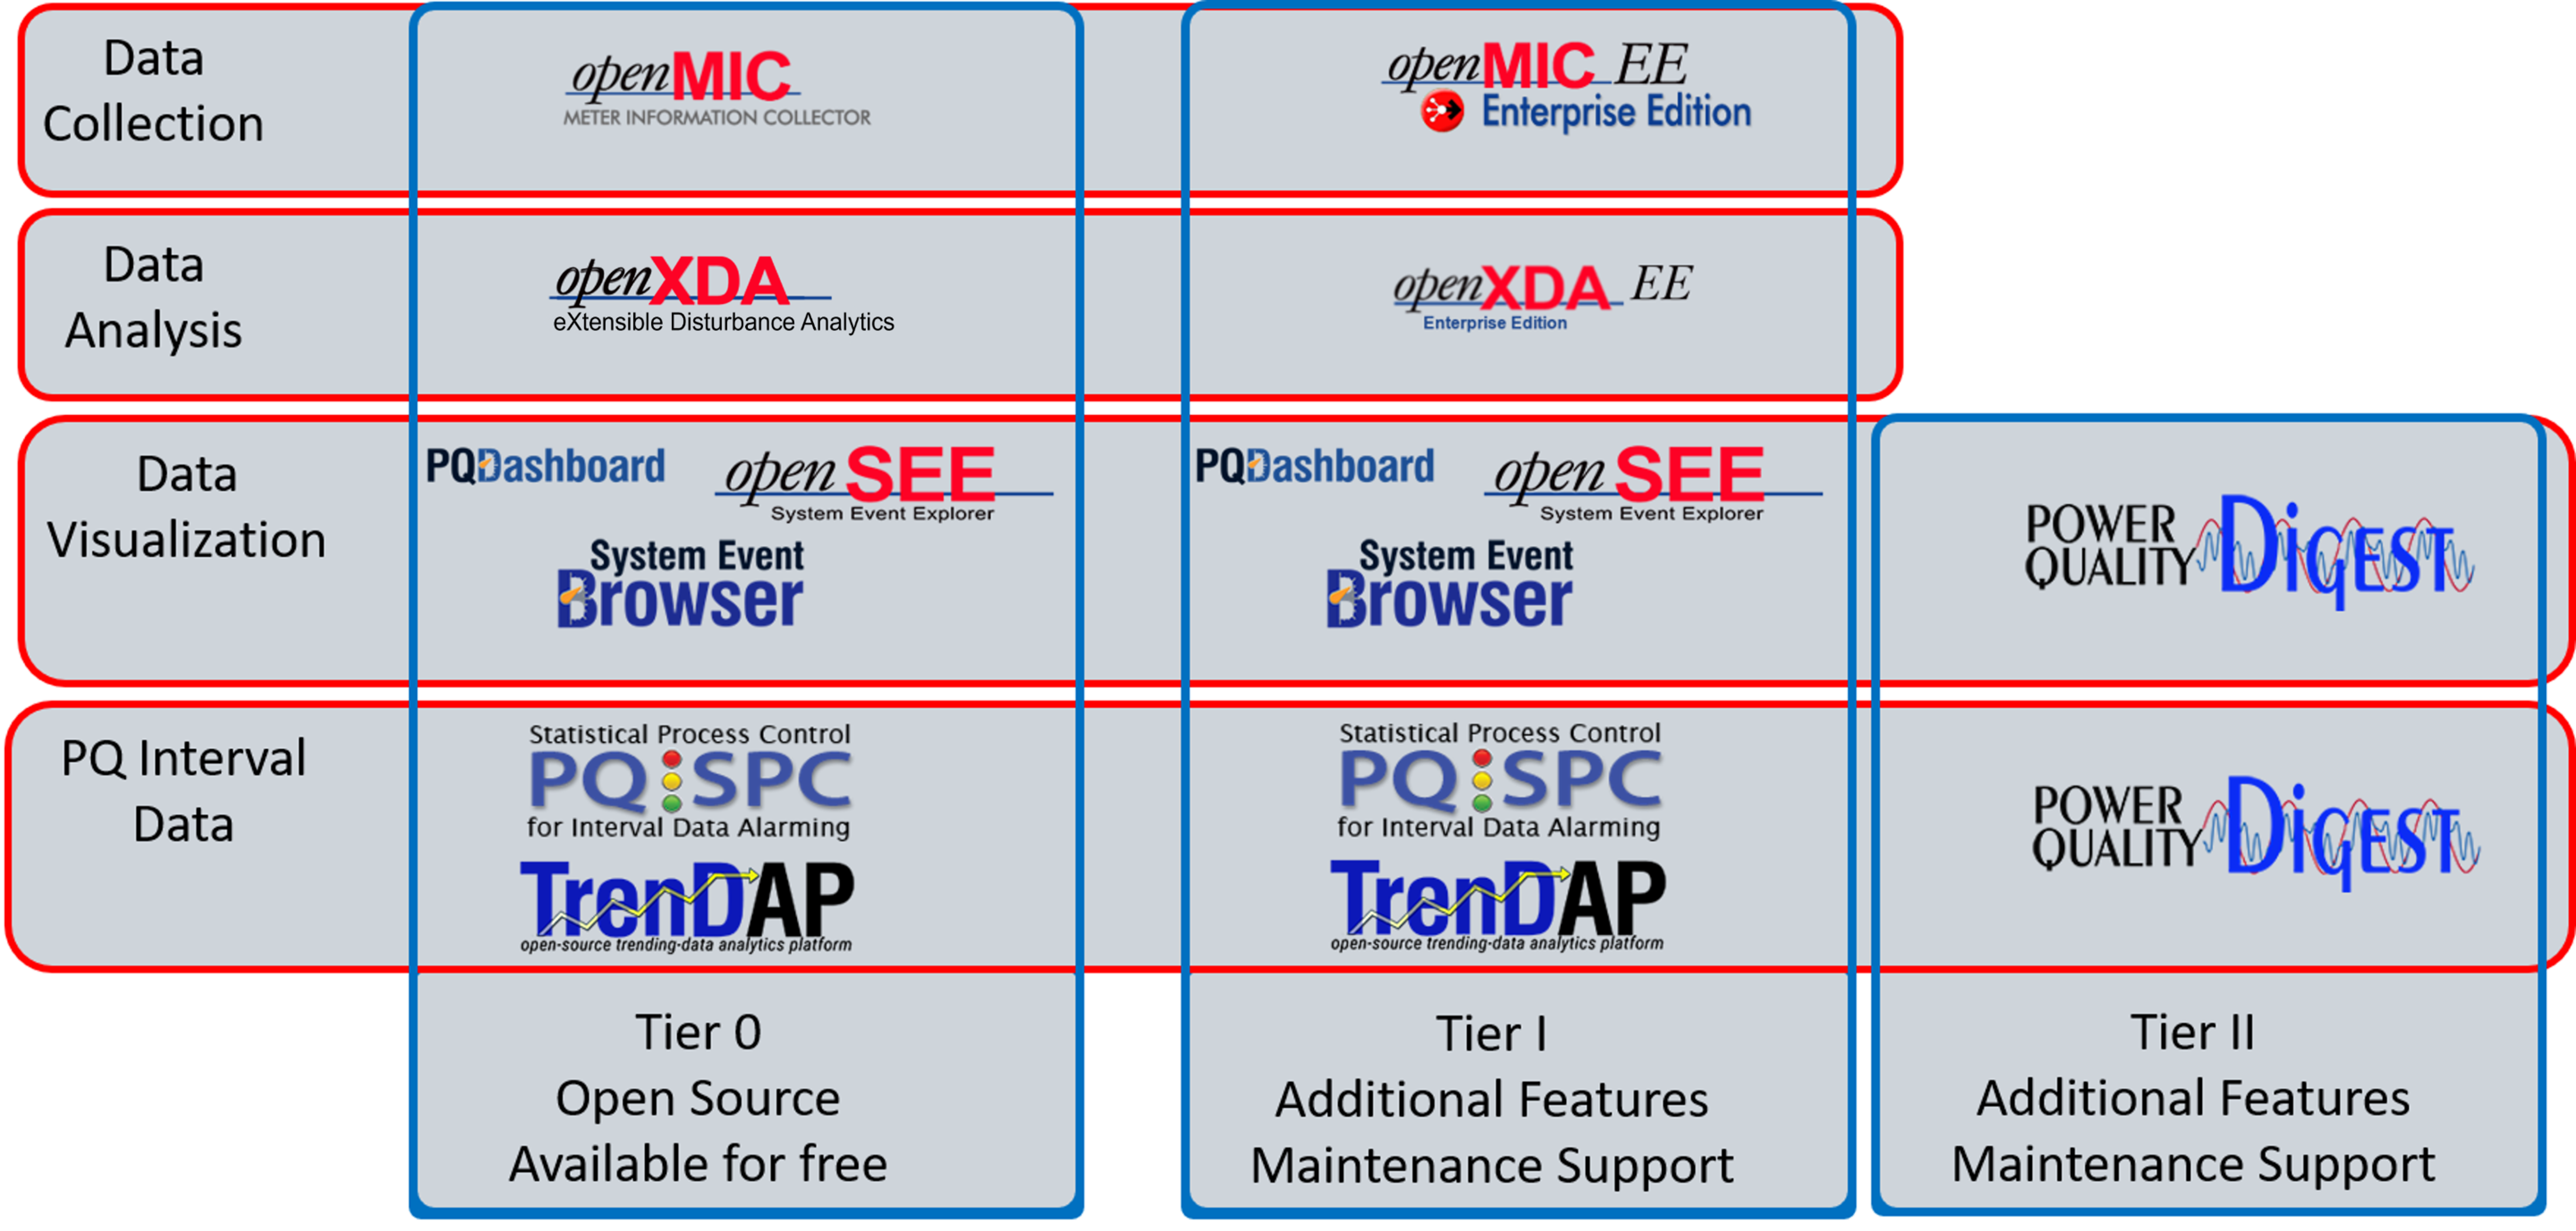
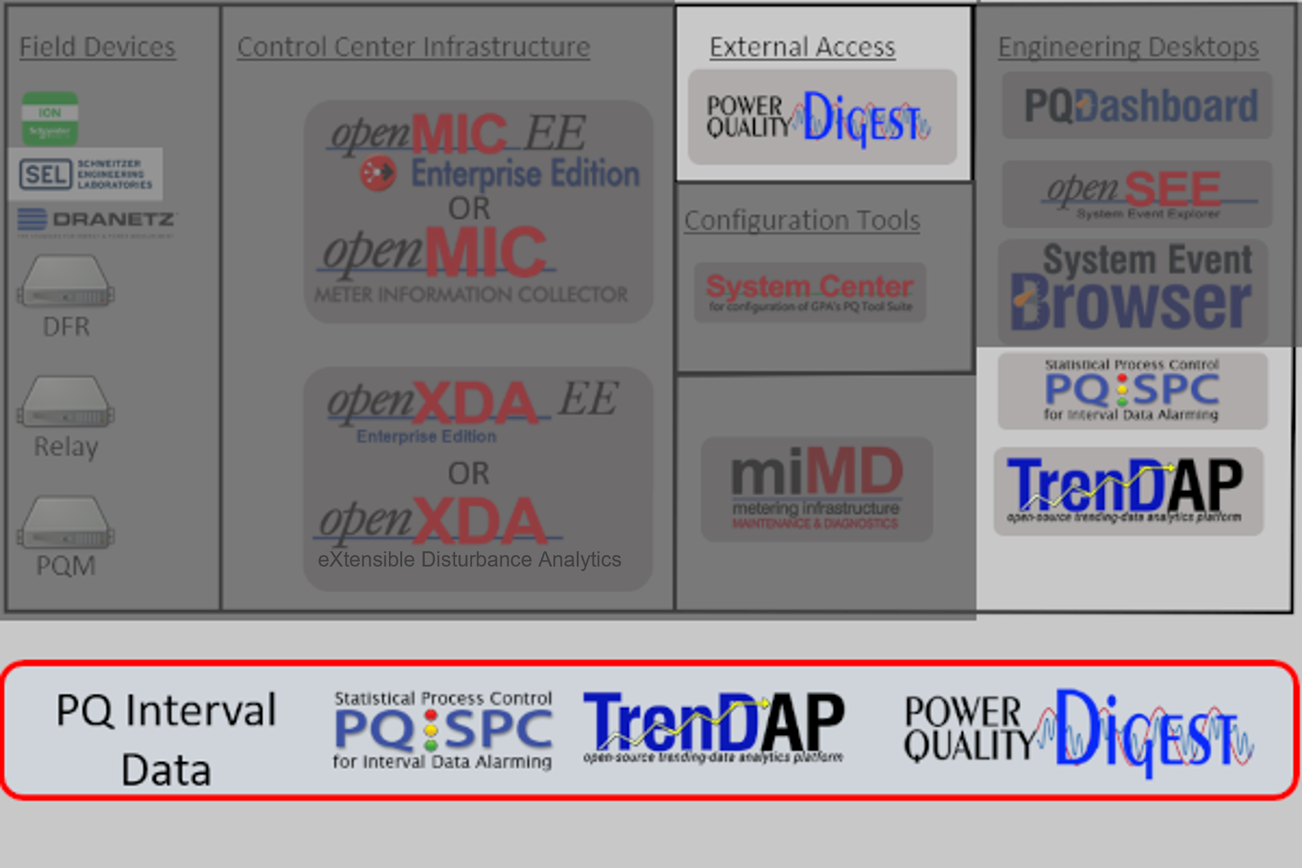
- SPC Tools - statistical tools to create alarm set-points for interval data
- TrenDAP - study tool for interval and time-series data
- PQ Digest - for external Stakeholder access to PQ data and specific analysis results
- Community Support
- Dedicated support
- Dedicated 24x7 Support Available

- SPC Tools - statistical tools to create alarm set-points for interval data
- TrenDAP - study tool for interval and time-series data
- PQ Digest - for external Stakeholder access to PQ data and specific analysis results
- Community Support
- Dedicated 8x5 Business Day Support
- Dedicated 24x7 Support Available

- SPC Tools - statistical tools to create alarm set-points for interval data
- TrenDAP - study tool for interval and time-series data
- PQ Digest - for external Stakeholder access to PQ data and specific analysis results
- Community Support
- Dedicated 8x5 Business Day Support
- Dedicated 24x7 Support Available

SPC Tools
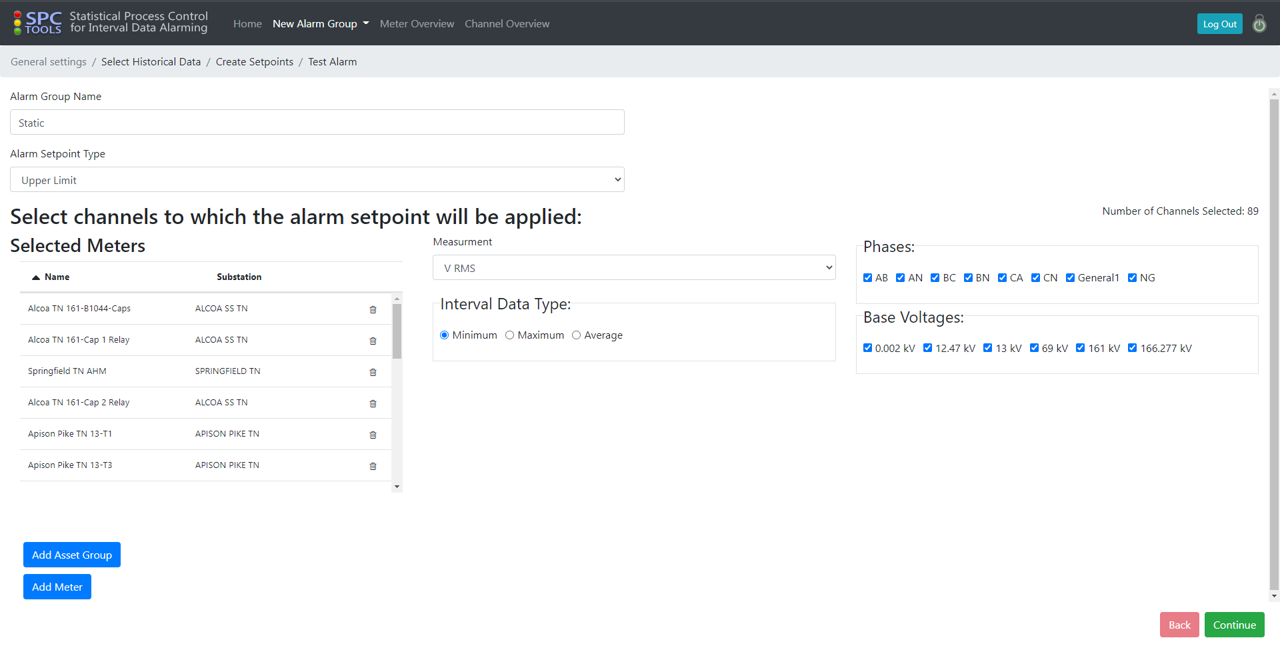
The Statistical Process Control (SPC) Tools can be used to automatically set alarm limits on PQ interval data, i.e., 10-minute min-max-avg data. SPC Tools is an open-source, browser-based application that is embedded in openXDA. It can be used to globally set openXDA alarm limits across a utility's fleet of PQ meters based on known fixed control points, such as regulatory limits for voltage control.
SPC Tools also provides features for users to create alarm set point models based on analysis of historical interval data so that alarms can be raised based on rare or unusual interval data excursions which may be well within standard regulatory control points. Once trial alarm set points have been established, SPC Tools lets users test these limits against large blocks of historical interval data to assure that the number and type of alarms are appropriate and meaningful.
Included as part of the openXDA download.
TrenDAP
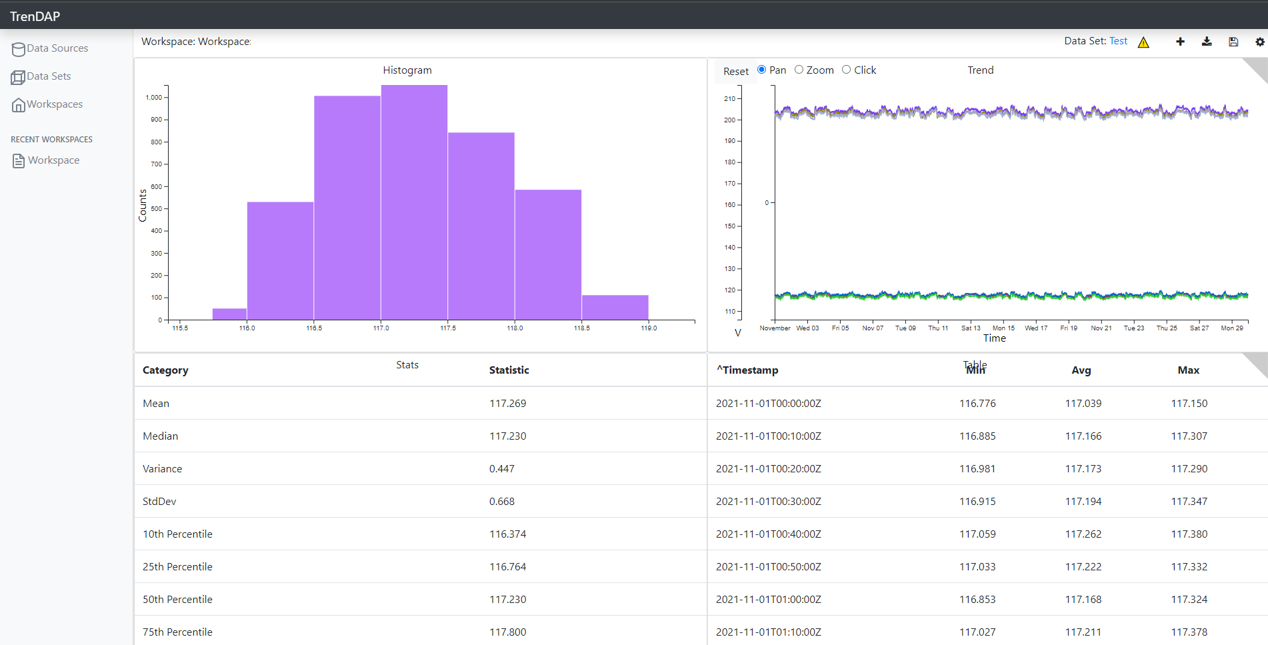
TrenDAP is an open source, web-based, engineering analytics tool - an analytic workbench - to assist PQ SME’s in conducting ad hoc PQ investigations. While TrenDAP is optimized for display of PQ interval data (e.g., min, max, average data captured periodically), it is also able to display time-series data from multiple sources, such as SCADA data.
The core features of TrenDAP are:
- A URL-driven browser-based application with security integrated with the openXDA suite of products.
- Performant at scale, i.e., for many years of history from many thousands of PQ meters (The largest systems may require horizontal scaling of the interval data layer).
- Ability to exclude values from display and analysis that have been automatically flagged by the “interval data loader service” as bad or unreasonable or as having other data quality issues.
- Ability to show event data tick-marks on the trend displays with links to open the event waveform in openSEE.
- Quick filtering options for most common use cases plus complex filtering options to precisely limit both the time range of data and the specific points to be displayed.
- Ability to create “calculated points for display” through application of a function library.
- Ability to perform statistical analysis on a time range of values.
- Ability to apply a filter expression to exclude values from either calculated values or statistical computations.
- Supports the capability to display IEEE compliance performance.
- Integration with interval data alarms.
- Ability to export data as a CSV for analysis on other platforms.


PQ Digest
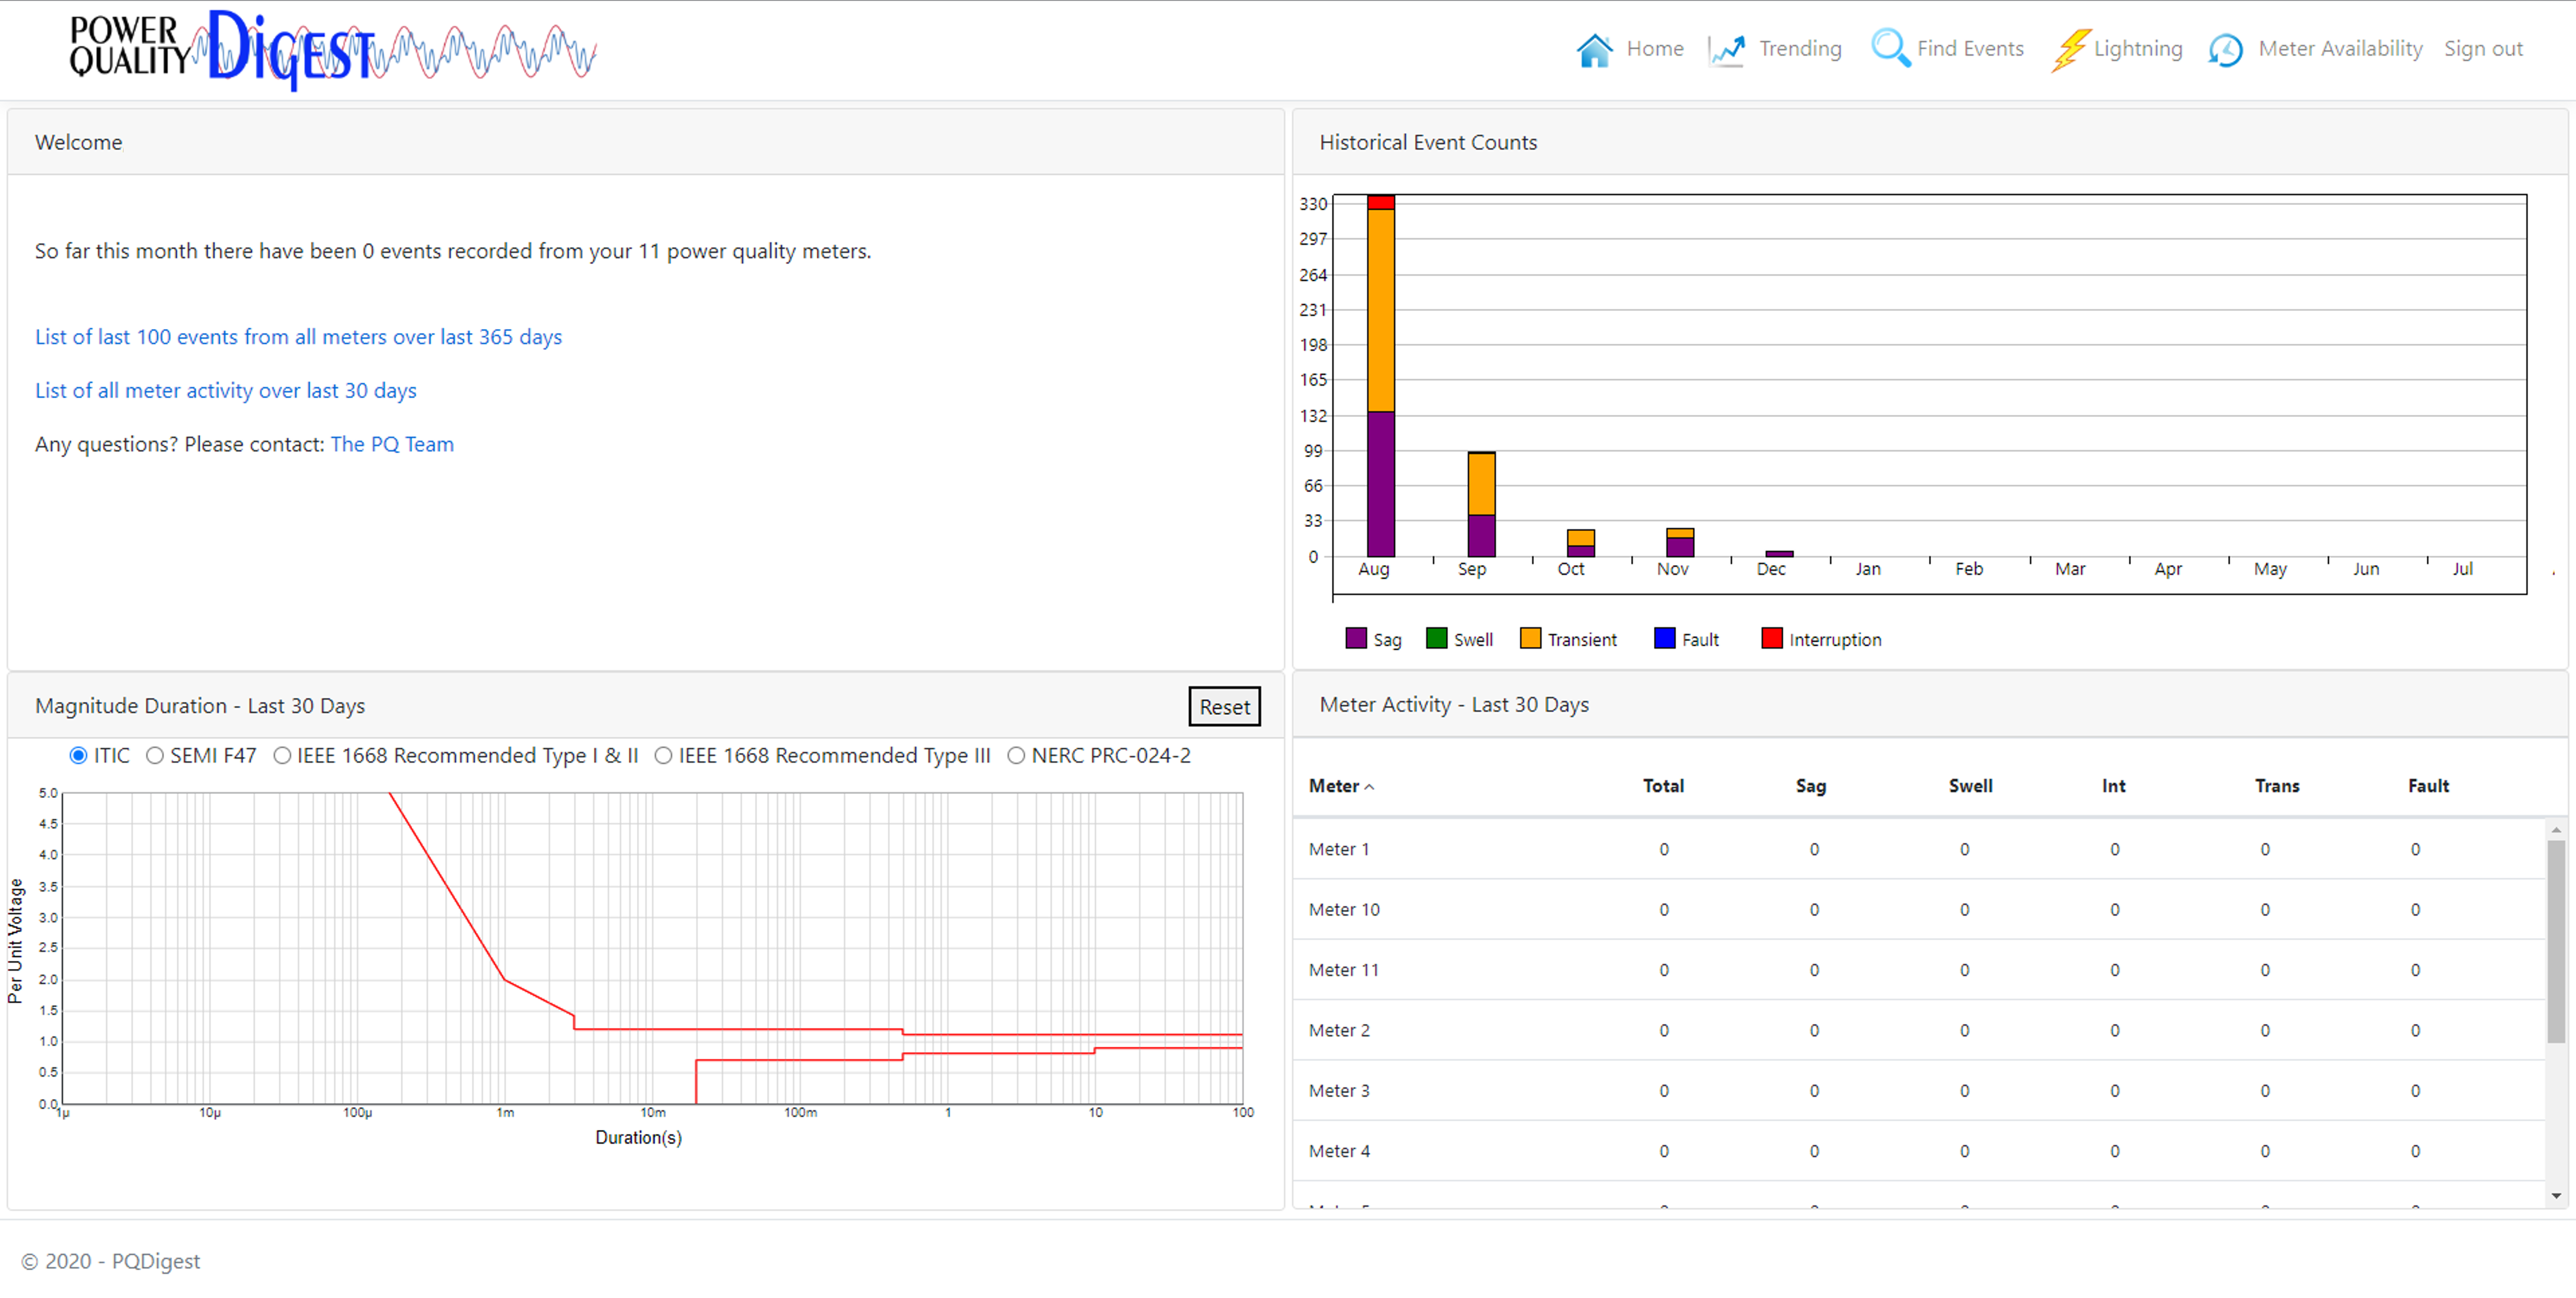
The PQ Digest application allows utilities to share power quality data with customers and stakeholders. In concept an "SE Browser Lite", the PQ Digest is designed for installation on a utility's externally facing web server to allow external users to have access to summary information about their power quality.
PQ Digest enables customers to view both event and trending data from PQ devices. In addition, it provides information on lightning strikes based on data from a utility's lightning data service.
